The TEN Spot
September 21
This week’s TEN Spot is a little different than normal. Instead of TEN random things, I am going to continue down the Mississippi River rabbit hole.
If you missed Tuesday’s HOT TAKE, click HERE for an aerial tour of a portion of the Mississippi River.
First things first:
HAPPY BIRTHDAY, GRANDMA!
84 years young today!
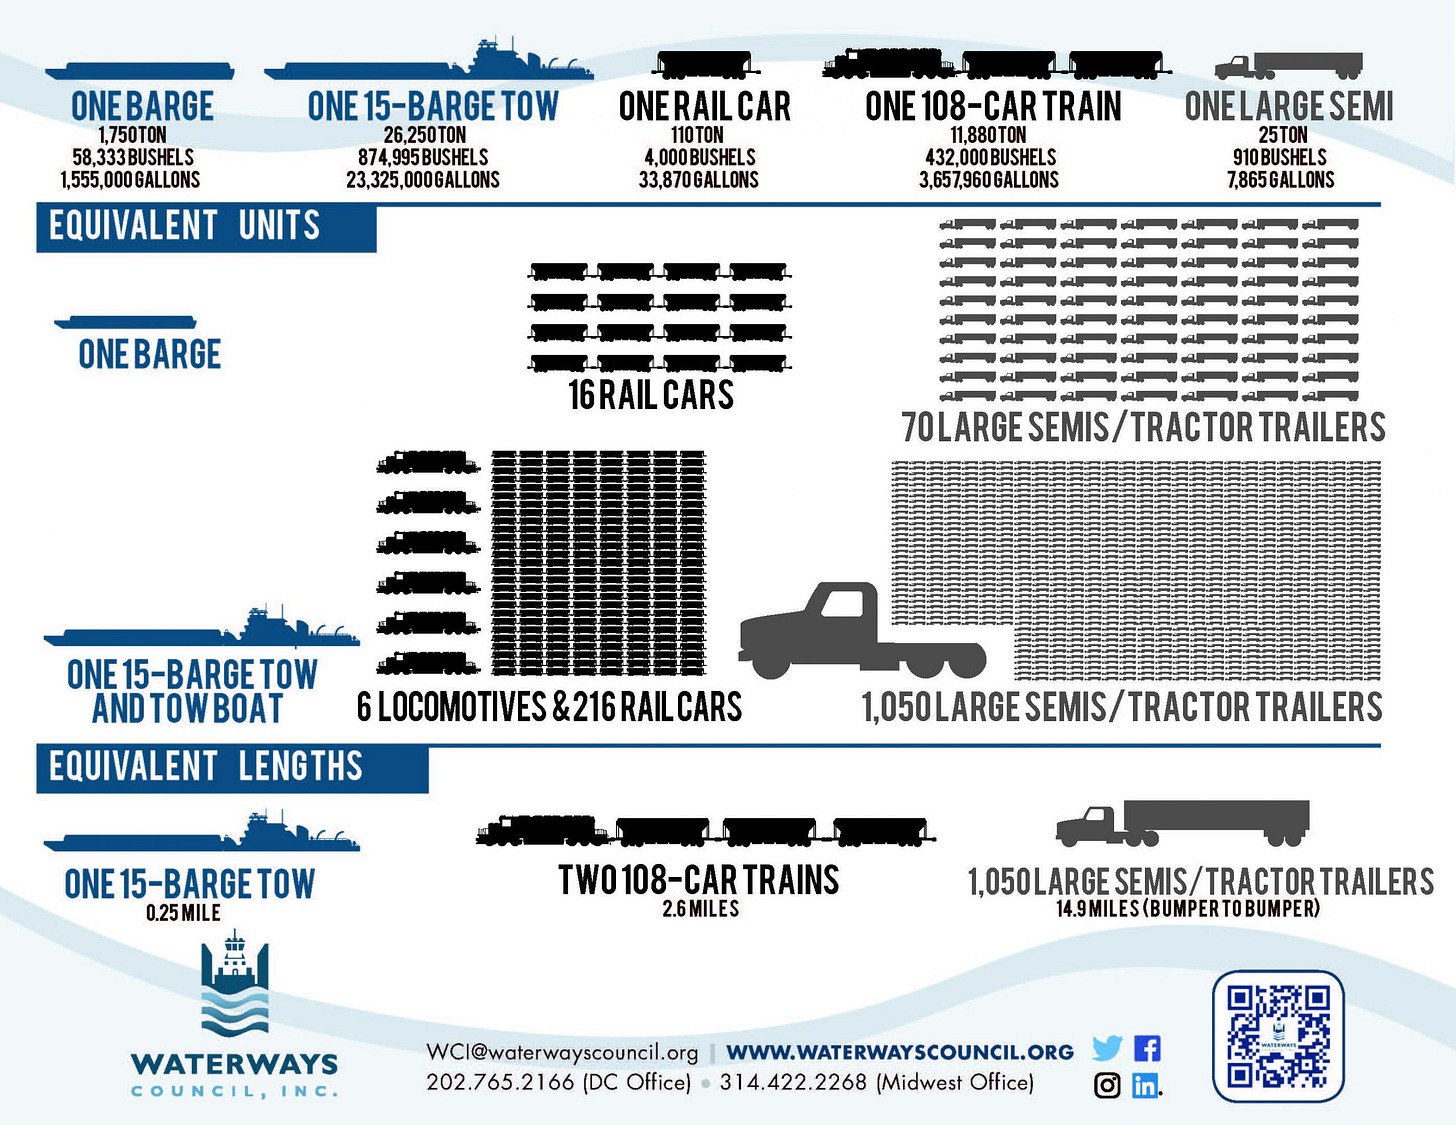
Barges 101
Before we start talking about river levels, freight rates and snarled inland waterway logistics, let’s compare barge capacities with other forms of transportation:
(keep in mind capacity varies depending on the barge, draft and tow size limitations which fluctuate based on location and water levels)
Not only are barges capable of moving massive amounts of cargo but they do it more efficiently than another other transportation type.
According to the National Waterways Foundation, a single barge can move one ton of cargo 647 miles on one gallon of fuel, compared with 477 miles per ton of cargo on a freight train or only 145 miles by truck.
Additionally, barges have the smallest carbon footprint among other transportation modes, emitting only 15.6 tonnes of GHGs per million ton-miles.
Freight 101
With the renewed focus on the U.S. Inland Waterways System, I figured it would be a good time for a crash course in barge freight calculations.
Just as corn and soybeans have supply, demand and prices that fluctuate accordingly, barge freight has a market (and mind) of its own.
Benchmark tariff rates
All freight calculations are based on benchmark rates that were established by the government in 1976, by location.
The further upstream, the higher the benchmark rate.
Makes sense, right? Sending a barge from Minneapolis to the Gulf is obviously going to be quite a bit more expensive than sending one a fraction of the distance from St. Louis to New Orleans.
Keep reading with a 7-day free trial
Subscribe to No Bull to keep reading this post and get 7 days of free access to the full post archives.


