


10 HOT Nuggets
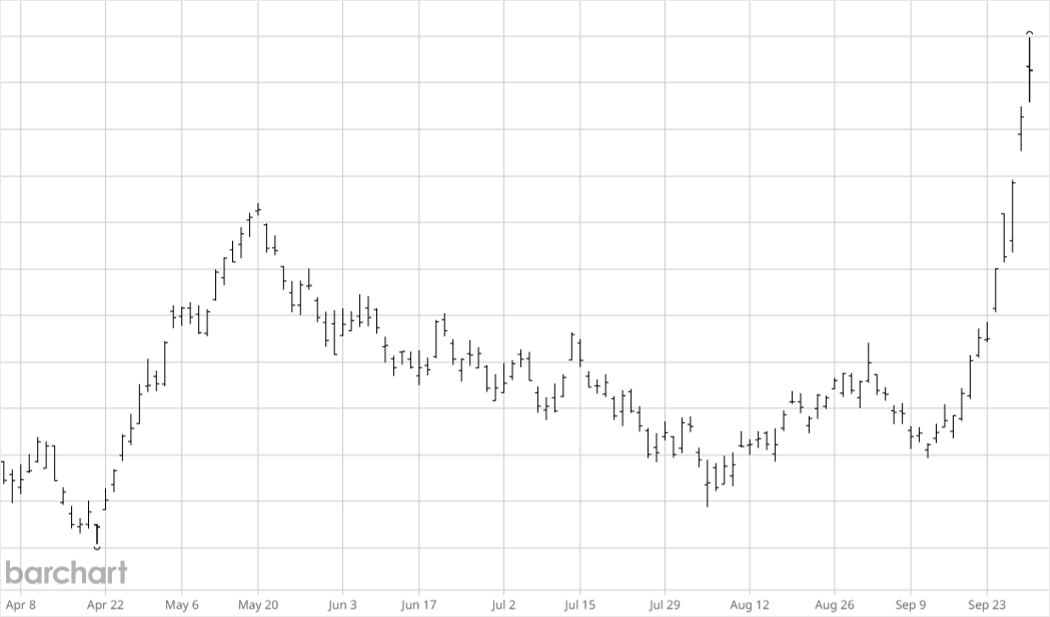
10 | Guess the chart
Up more than 26% from its mid-September lows, making a new all-time high today:
Answer (and reason it is important to commodities can be found in today’s #1)
9 | Commodities vs. Equities
50+ years of commodities vs. equities in one chart:
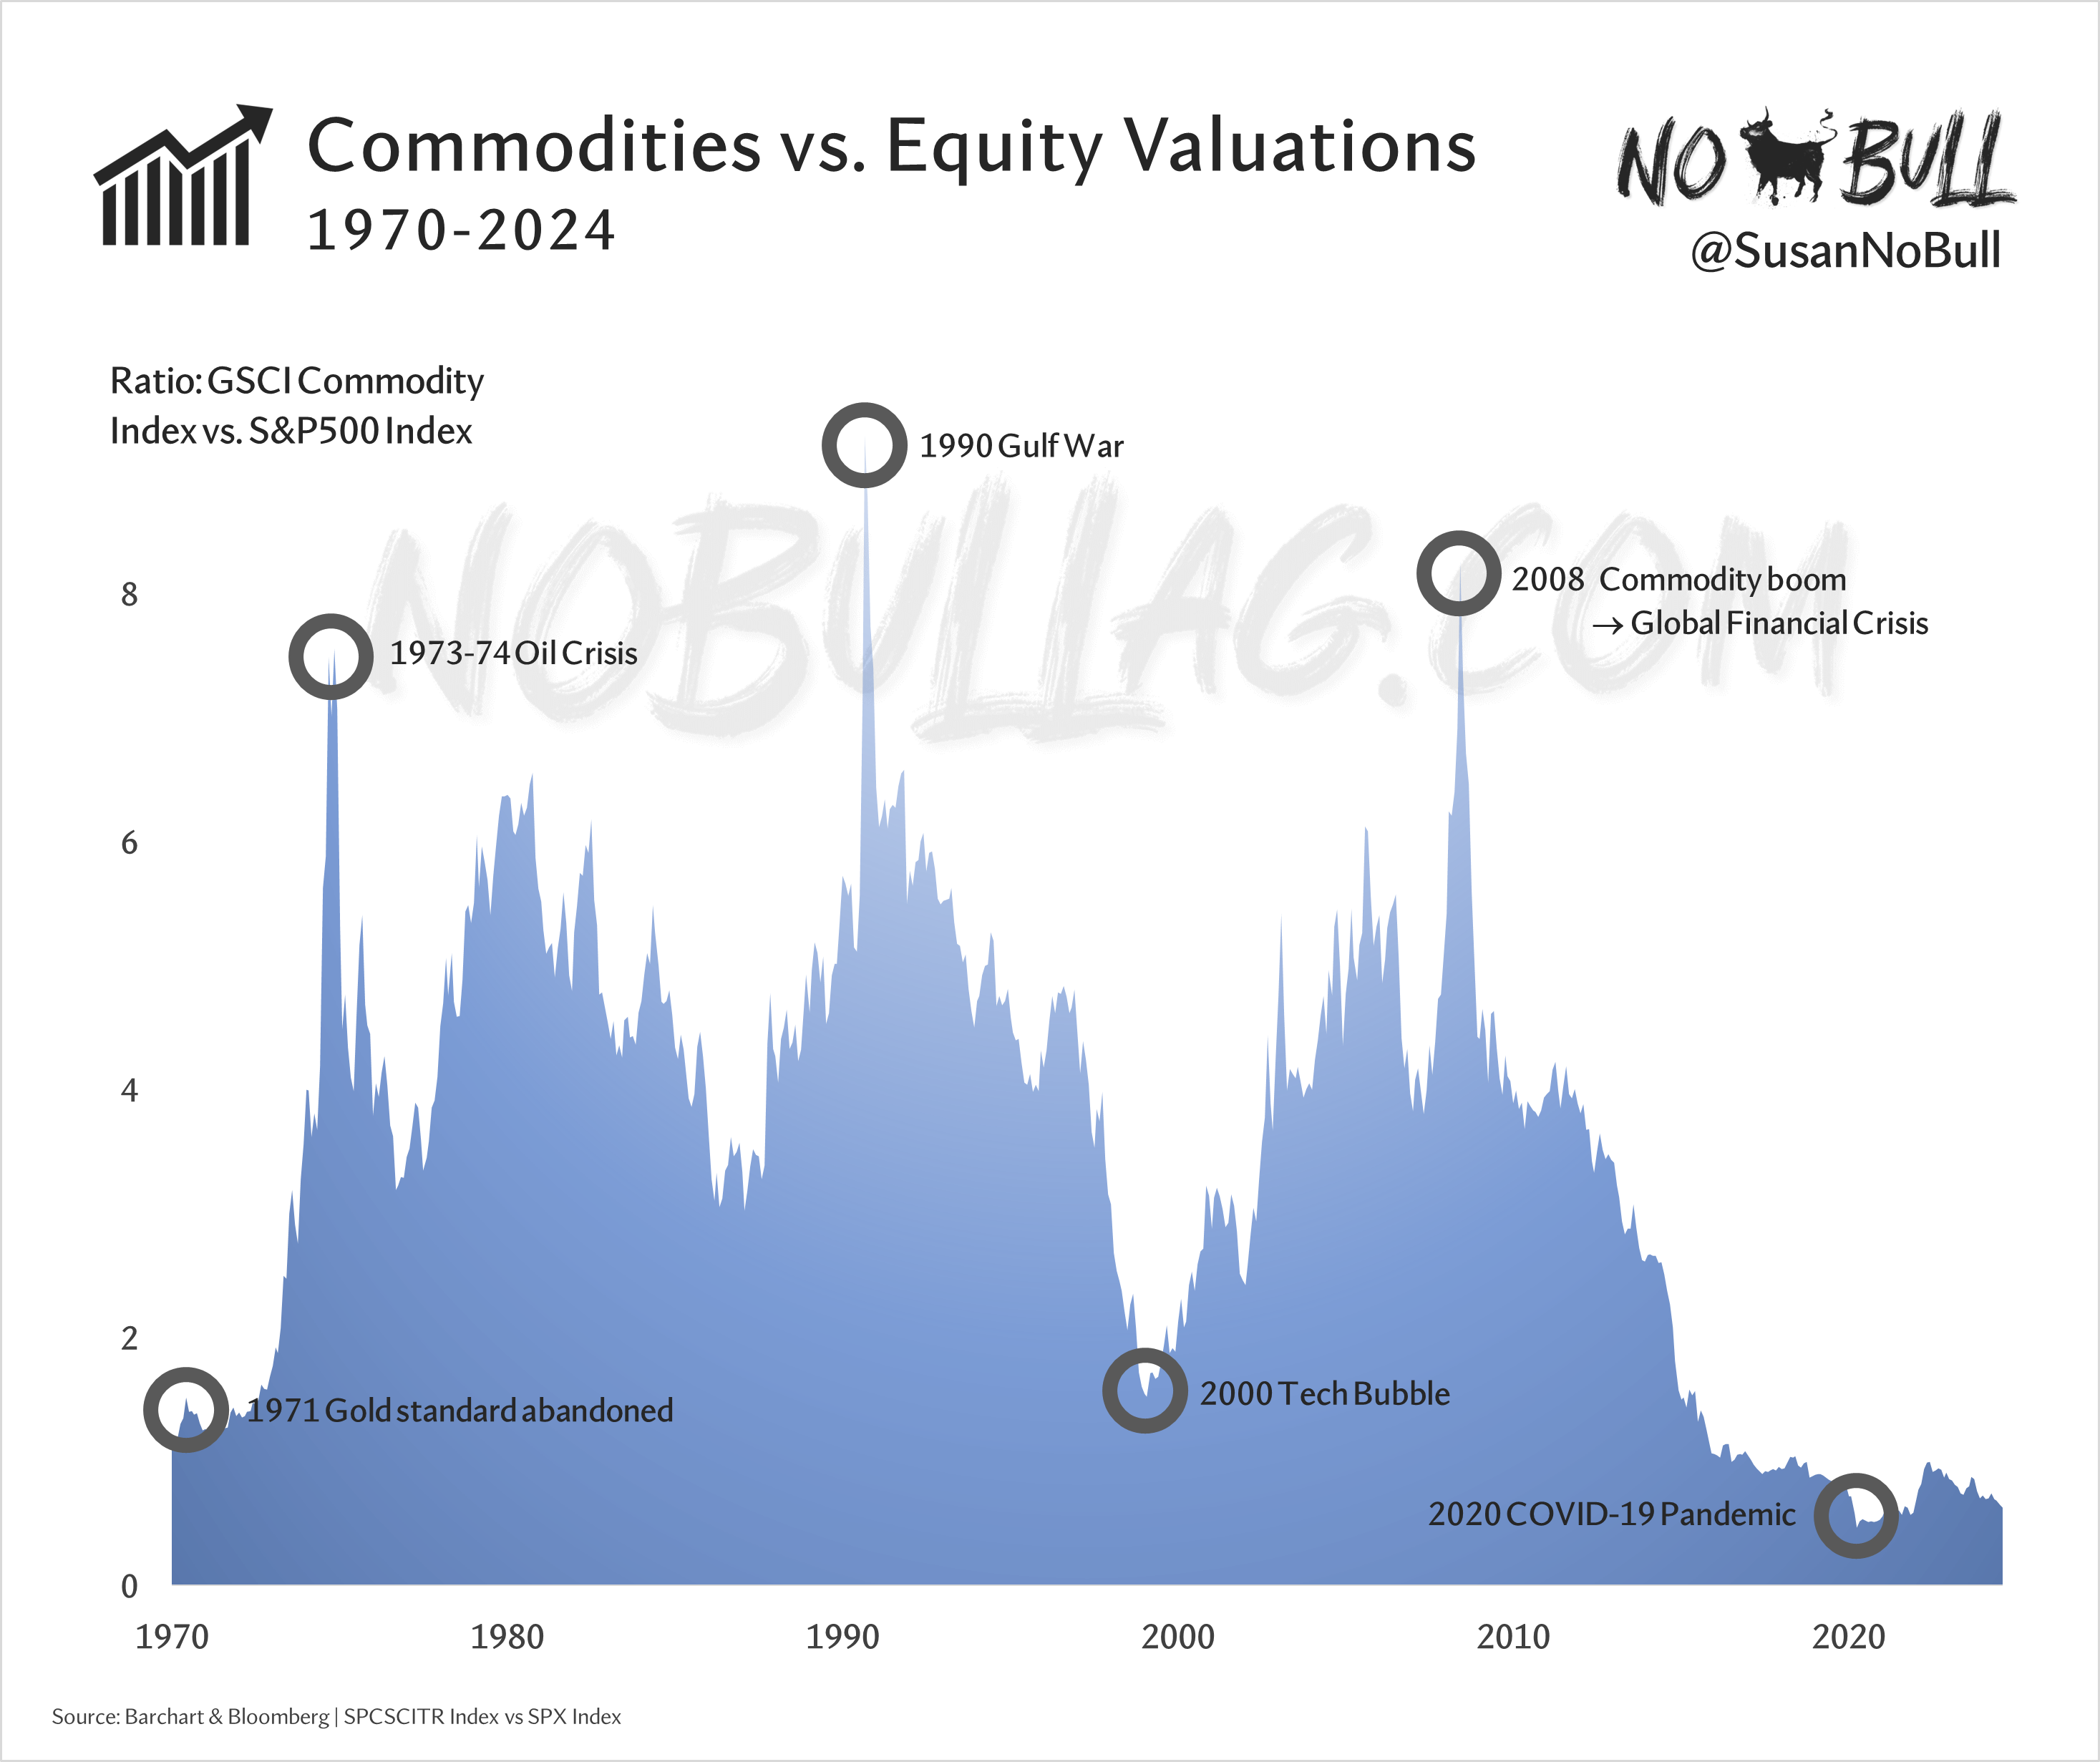
Notable events of the past 50+ years:
1971 | Abandonment of the gold standard left its value skyrocketing until 1980
1973-74 | OPEC’s oil embargo against the U.S. during Arab-Israeli War more-than-doubled oil prices
1990 | Gulf War disrupted oil production and supply
2000 | Tech bubble led investors to shift to commodities, surging markets
2008 | Commodities at all-time highs amid emerging market growth, followed by a sharp decline during the Global Financial Crisis
2020 | COVID-19 Pandemic lockdowns slashed commodity demand. Central banks and governments flooded markets with stimulus
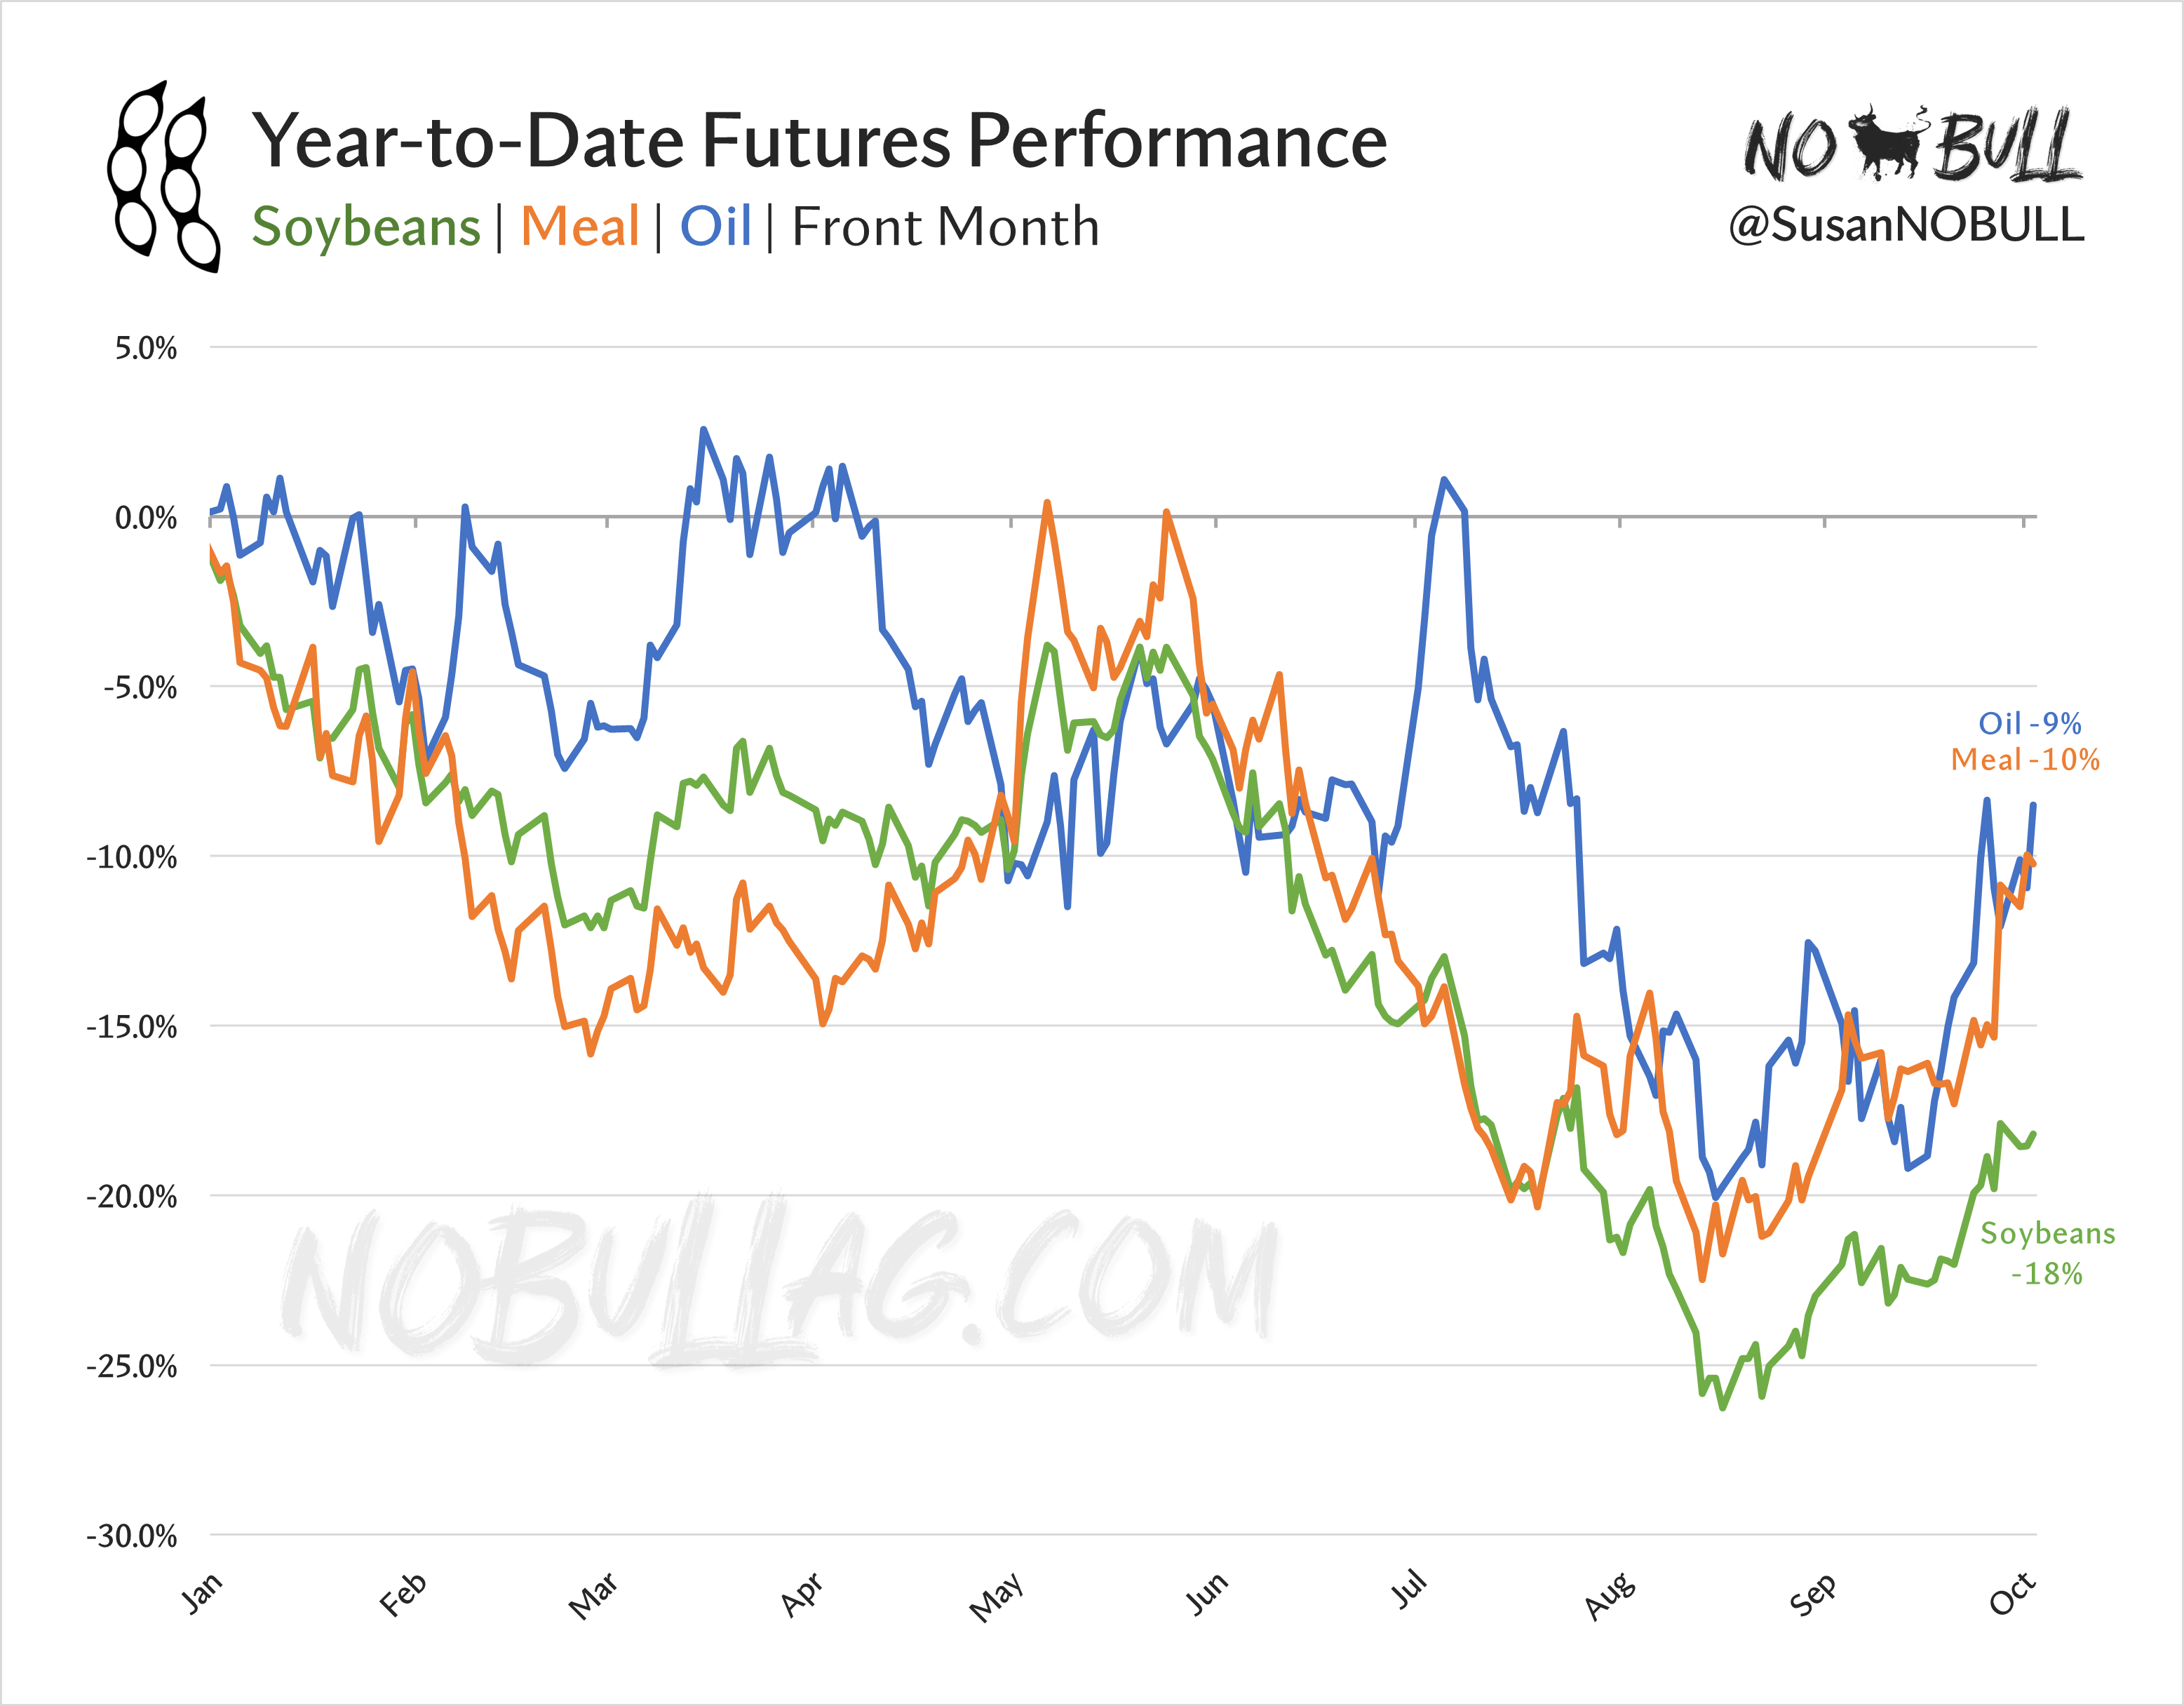
8 | Winners & Losers
Taking a closer look at year-to-date performance of select markets:
(as of 10/01)

7 | Losers & an even bigger loser
Soy products have outperformed beans thus far in 2024:
Year-to-date managed money positions in the soy complex:

6 | Winning
What happens when soy products out-perform the beans they are made from?
Keep reading with a 7-day free trial
Subscribe to No Bull to keep reading this post and get 7 days of free access to the full post archives.