


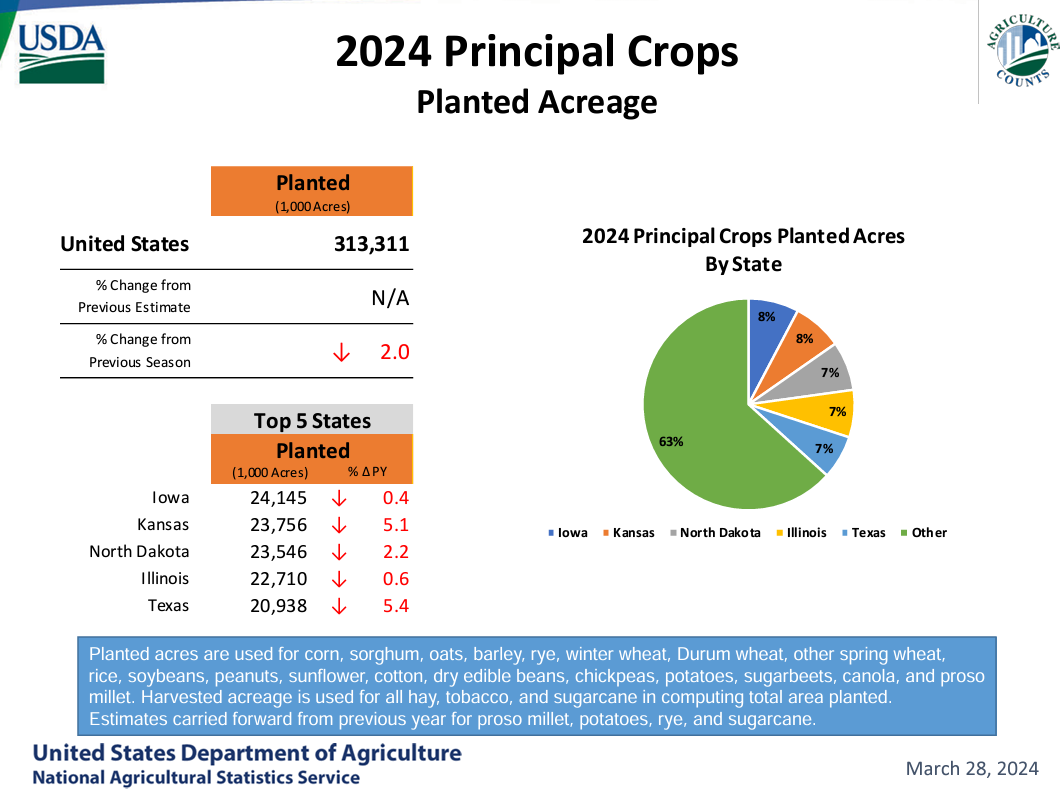
Acres
Timing is everything:

Low(er) prices are trying to cure low(er) prices in the form of less acres:
Red, red everywhere:

All of corn’s red on the board resulted in a lot of red on the map with US acres down 4.9% YOY at 90.0 million. The largest declines were seen in southern states, Missouri and Minnesota:

At 90.0 million, corn acres were nearly 2 million acres less than the average pre-report estimate and at the very bottom of pre-report estimates:

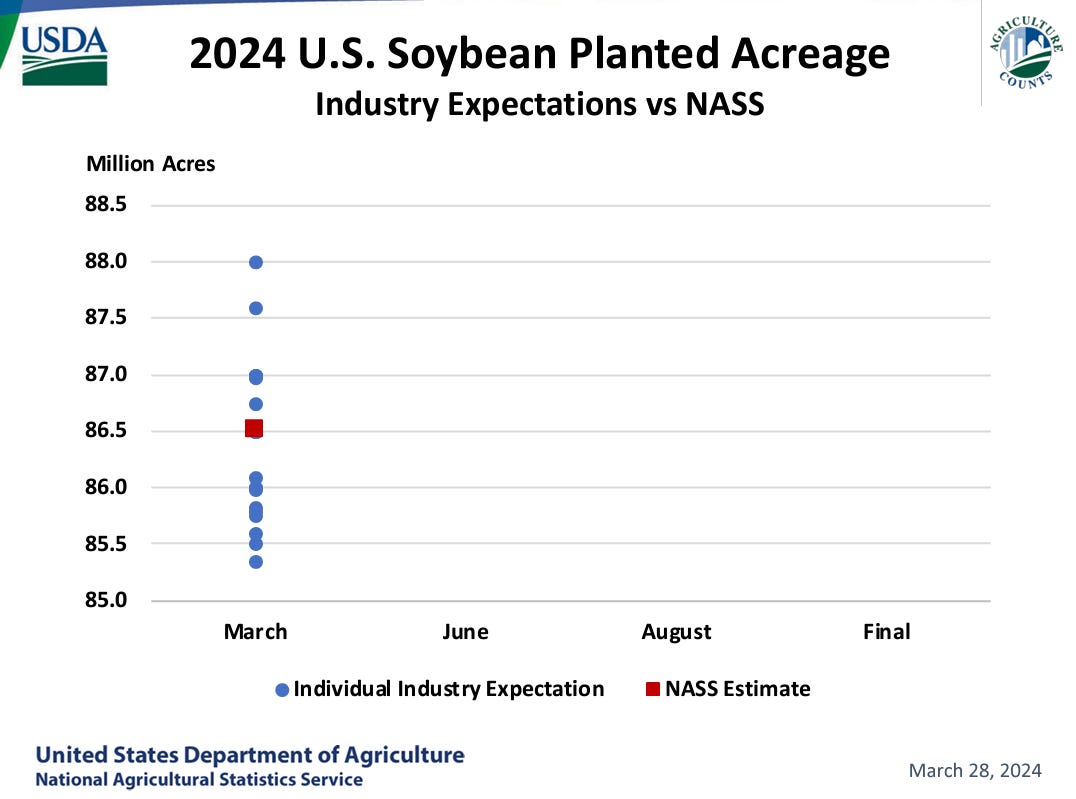
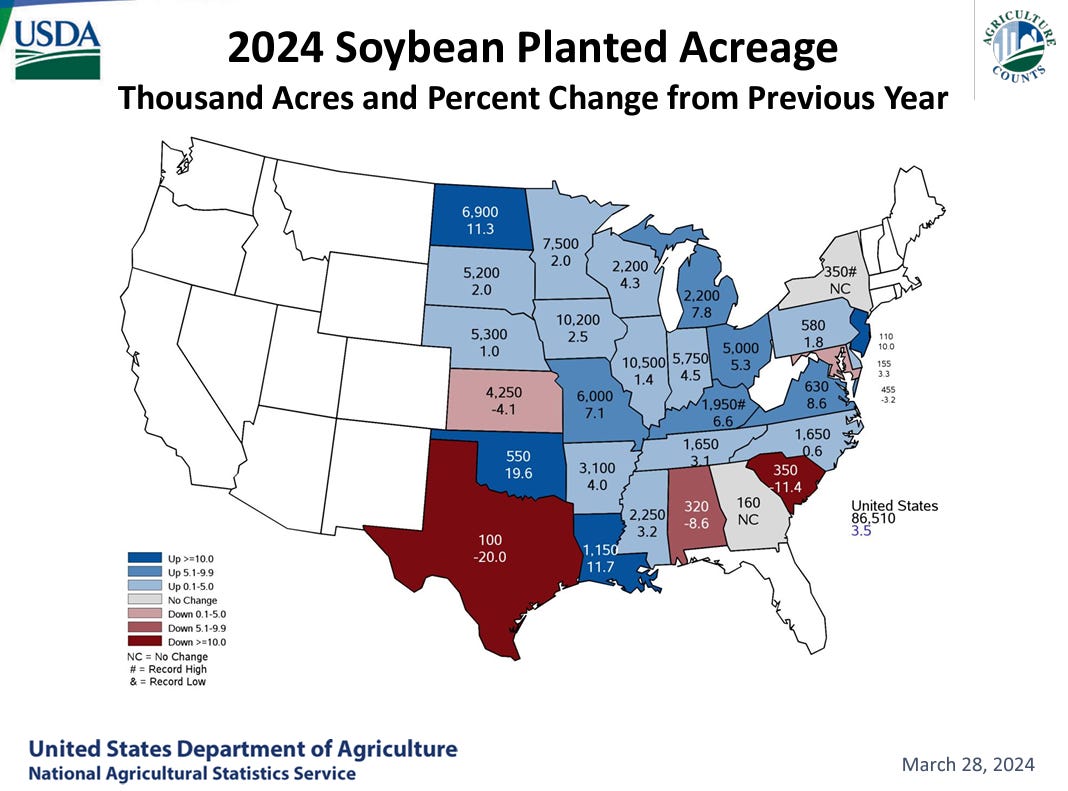
Bean acres were in line with expectations at 86.5:
All major bean states saw a year-on-year increase in area with the exception of Kansas:
Actual vs estimates vs history:
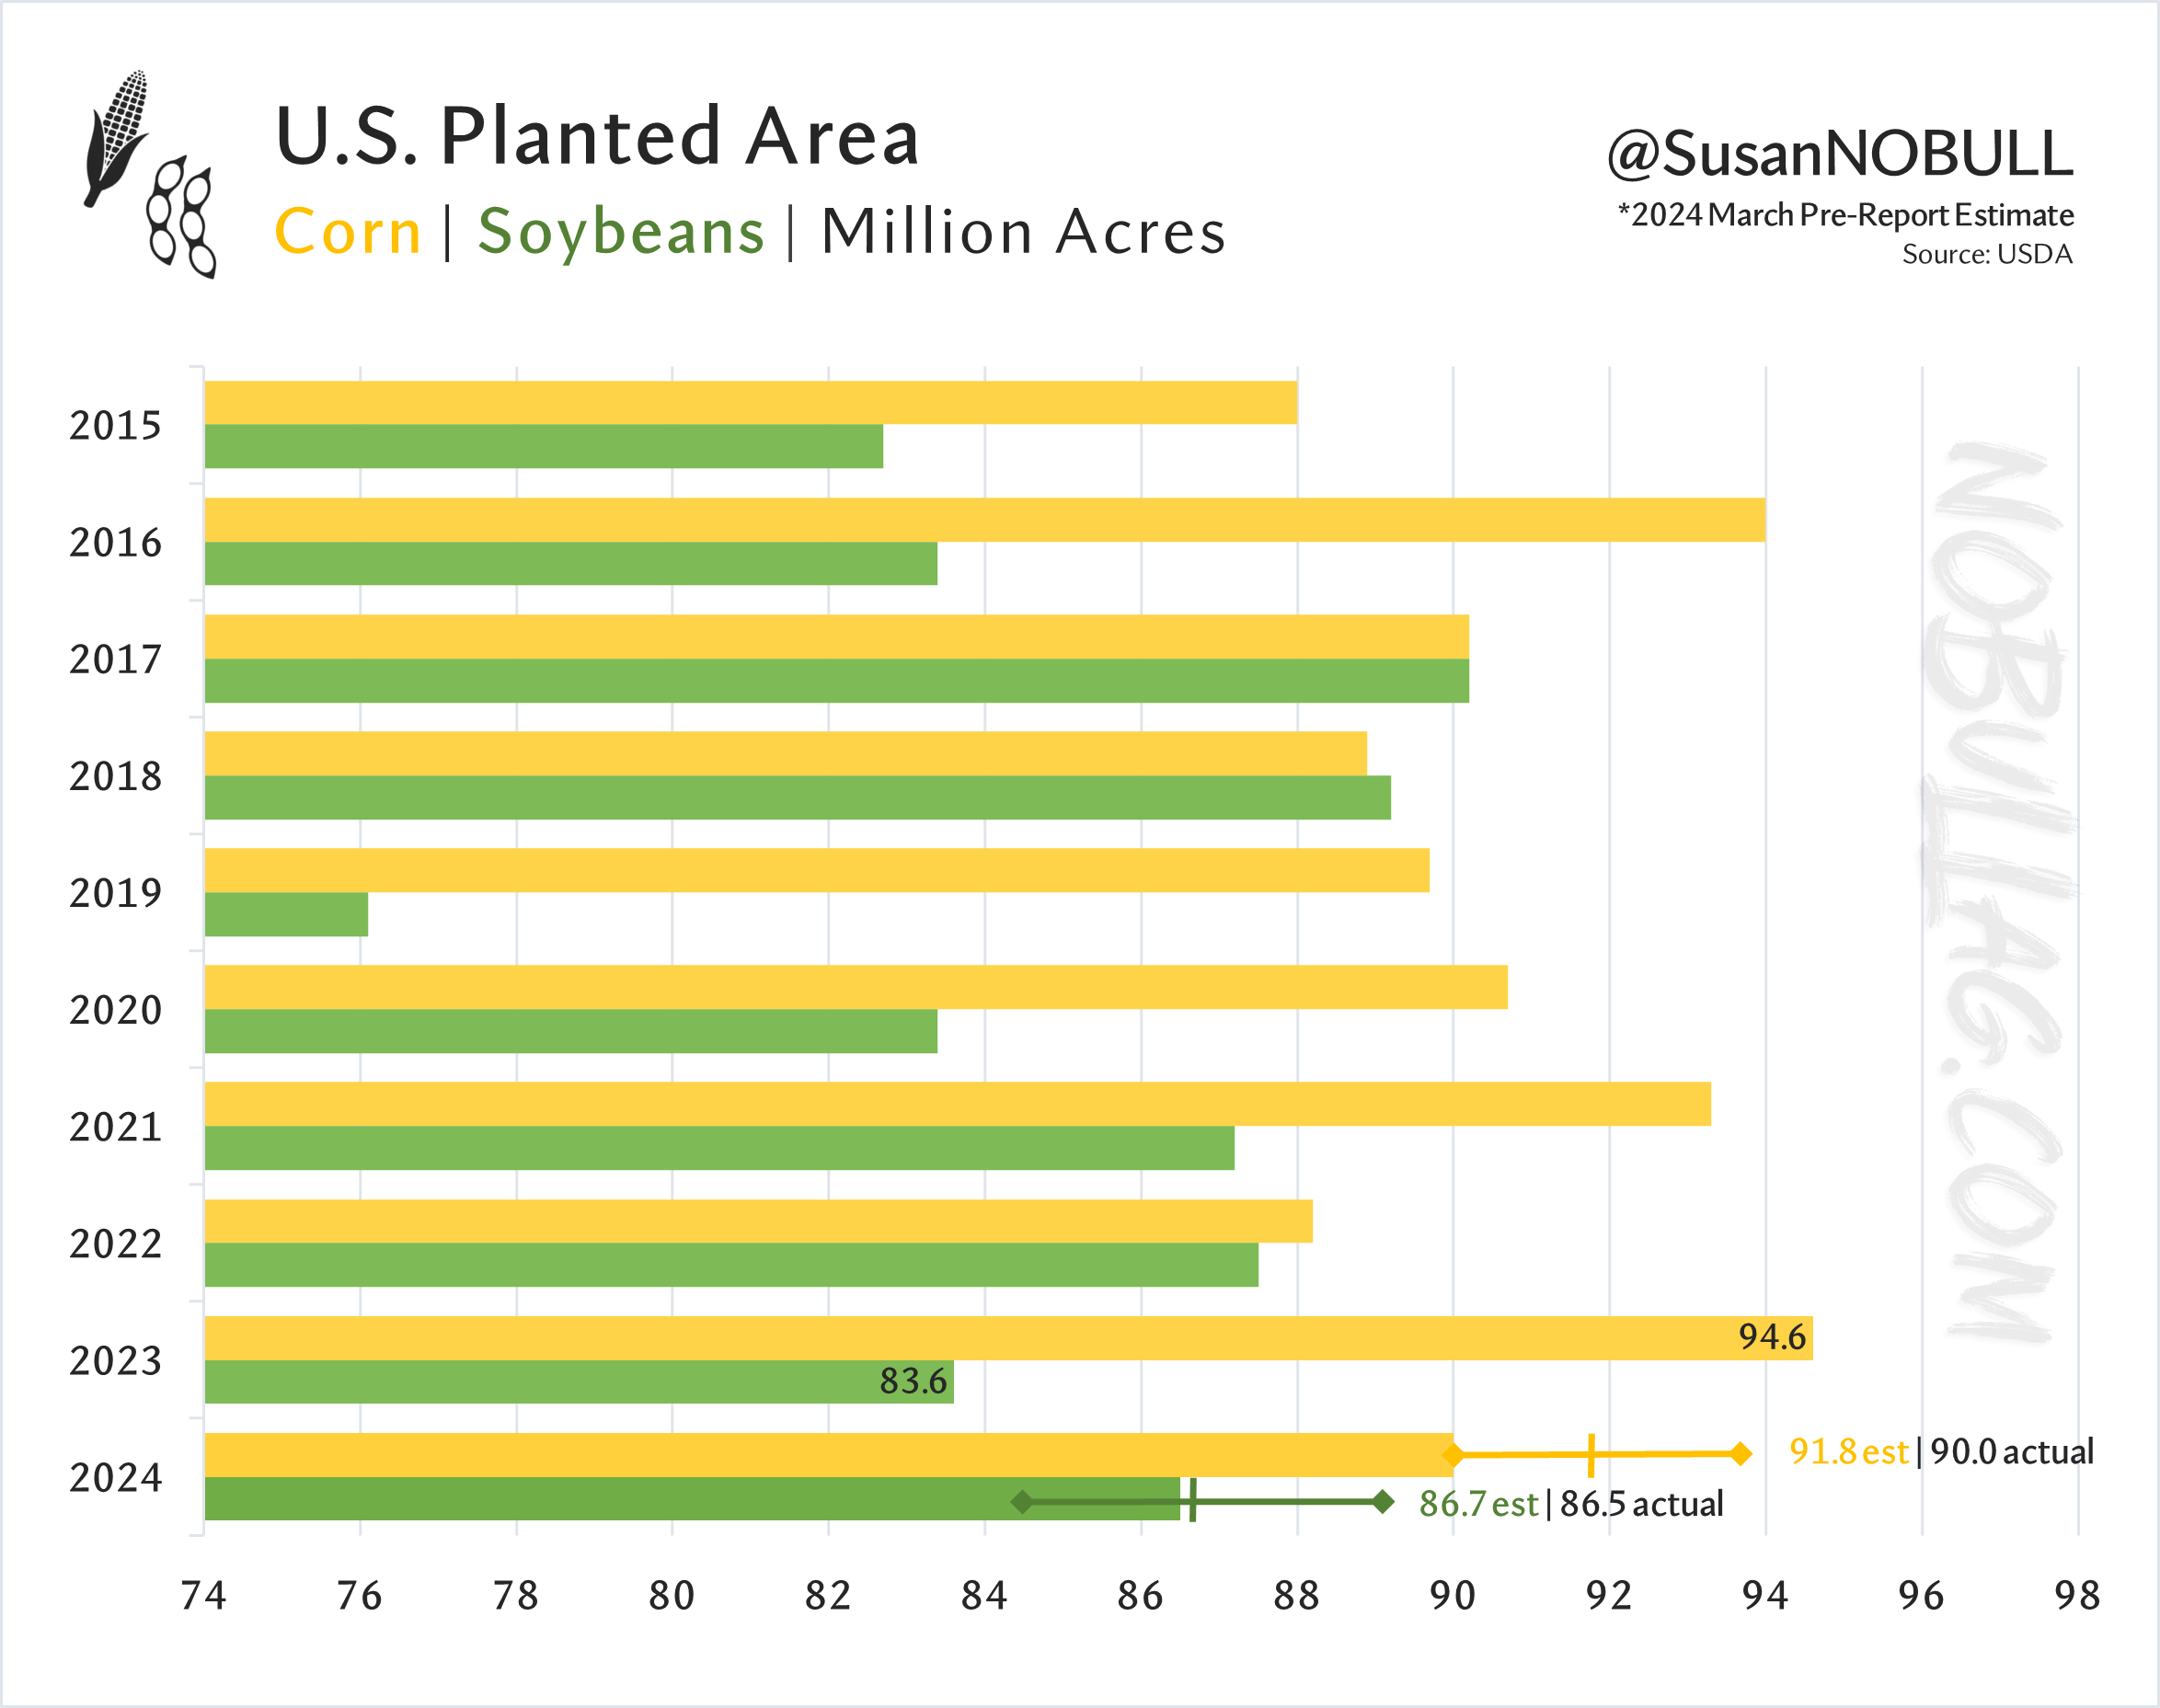
The downside surprise in corn acres left the corn+bean acreage pool much smaller year-on-year and 2 million acres below the average trade estimate:
Keep reading with a 7-day free trial
Subscribe to No Bull to keep reading this post and get 7 days of free access to the full post archives.