


Even the best operators have breakdowns on occasion. Thankfully he has Genevieve on hand to assist.

Back in action!


Third time’s a charm, so one last Ask the Experts before we get back to the normal No Bull each Thursday.
Last week, Denise Gutzmer of the National Drought Mitigation Center joined us to discuss drought and its impact on crops.
This week, we take it a step further as I am joined by two Senior Analysts from Gro Intelligence to discuss yields, U.S. drought and its longer-term impacts going forward, plus La Niña’s three-peat.
Gro Intelligence is a data and analytics company that is focused on solving real world systems like food security and climate change. Their unique combination of predictive and proprietary analytics, up-to-date data, and domain expertise helps teams across industries manage risk, adapt to changing weather conditions, and make short-and long-term forecasts with greater confidence.
Gro’s clients include players across the agricultural supply chain and range from large food and beverage companies to some of the world's largest financial institutions and asset managers, as well as public institutions that range from government agencies to humanitarian organizations and foundations such as the Rockefeller Foundation and the Bill and Melinda Gates Foundation.

Before we get into talk about yields and such, can you tell me a bit more about Gro?
Gro Intelligence combines more than 650 trillion data points from sources ranging from various public and private organizations reporting agricultural and economic statistics to satellite imagery with AI (artificial intelligence) to create models that predict everything from the impact of natural and manmade disasters on food supply to how weather events affect the price of goods.
Oh, only 650 trillion data points?! The only number I know remotely close to 650 trillion is the government’s spending deficit.
Can you explain how you use all of those data points and specifically, how it applies to agriculture?
Gro currently combines data from over 47,000 datasets which we then use to generate over 30 modeling frameworks that generate 16,400 proprietary Gro datasets and over 2 million unique Gro data series and models.
With access to Gro’s data and predictive analytics, clients can leverage our information to predict the supply, demand, and price of commodities. You can learn more on our models page HERE, and our applications page HERE.

You also keep a watchful eye on fertilizer. Can you tell me a bit more about your Global Fertilizer Impact Monitor?
Gro Intelligence's Global Fertilizer Impact Monitor, launched earlier this year, is the first tool to help quantify the potential impact on global production of major crops from reduced applications of nitrogen fertilizer under different scenarios in a fully transparent way.
The Monitor, which Gro built with support from the Bill & Melinda Gates Foundation, is free for anyone to use and can be found HERE.

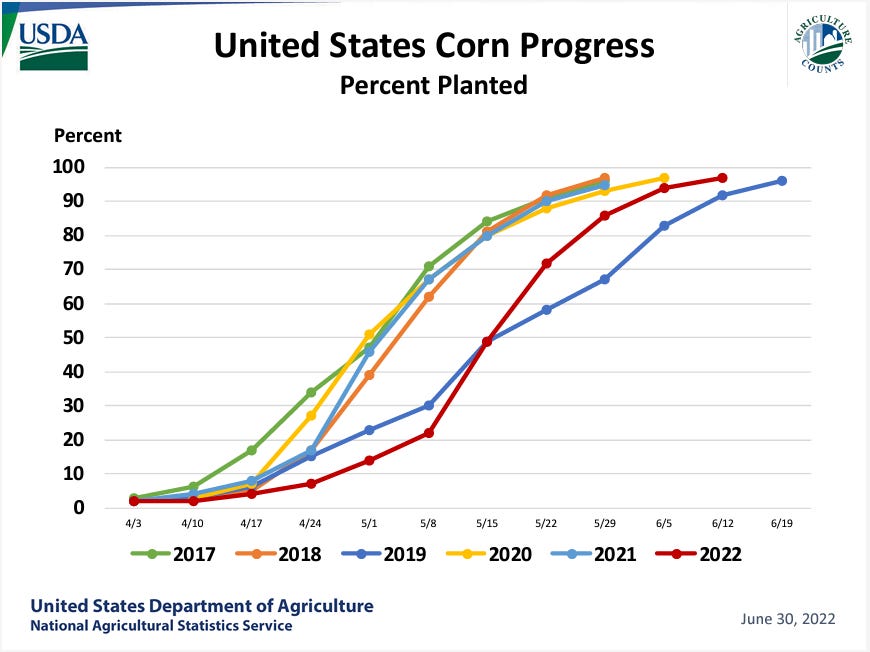
Alright, down to business: USDA released updated 2022 yields yesterday.
After two consecutive months of declines, US soybean soybean yield was raised 0.4 bpa from October to 50.2 bu/acre.

Likewise, corn was up 0.4 at 172.3, for the first month-on-month increase we have seen this season.

USDA will not release their final 2022 yield estimates until the January 12 report, but what are your models suggesting for 2022 final yields?
Gro’s yield models point to a 169.8 bu/acre final yield for US corn and a 48.9 bu/acre final yield for soybeans.

What were the most notable drivers of yield this year?
Delayed planting to start the year followed by hot temperatures and inadequate soil moisture levels led to sub-par yield performance.

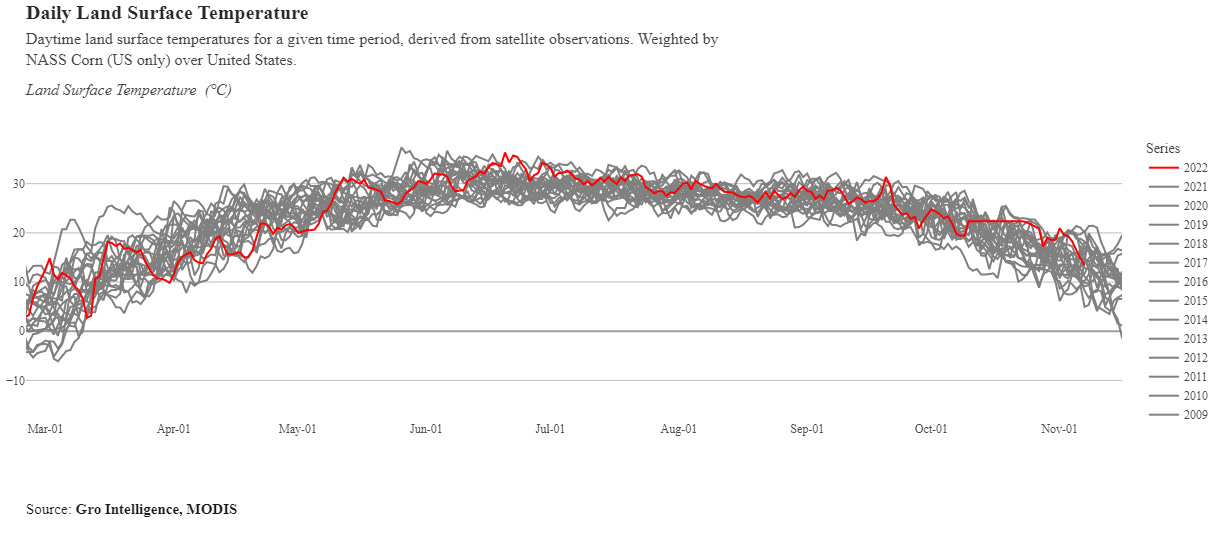
We also saw significant drought in parts of the Western Corn Belt that built through the growing season.

The Drought Index, weighted by corn area over the U.S. accelerated later in the season.

Let’s talk corn for a minute. USDA printed a 172.3 bpa yesterday, while you are just below a 170 nationally for final yield.
November’s estimate is down nearly 5 bpa from July and nearly 8 off of their 181 trend. Was precipitation just plain inadequate all season long?
Cumulative rainfall over the whole country, weighted by corn planted area, doesn't look that bad. Even the Western Corn Belt since Jan 1 was not terrible. August was dry, though.
Certain areas of the Belt suffered during August, while others saw good finishing rains.

USDA pegged Illinois at a record 215 bpa, bearing their old record (2018) by 5 bpa.
Keep reading with a 7-day free trial
Subscribe to No Bull to keep reading this post and get 7 days of free access to the full post archives.